Case Study: Lacunae Analysis with ETH, Zurich
In collaboration with the Laboratory for Bone Biomechanics at the Institute for Biomechanics, ETH Zurich we used XamFlow to analyse lacunae in human bone.
“I’m astonished XamFlow could analyze my entire dataset in one day. I had previously planned one to two months of computation time for this analysis without XamFlow!” – Elliott Goff, Laboratory for Bone Biomechanics, ETH Zurich
Dataset
113 samples of human iliac crest bone biopsies
Cortical bone and trabecular bone scanned separately
226 images
10 to 18 GB per image
3.5 TB image data in total
Over 24 million lacunae
Thresholding
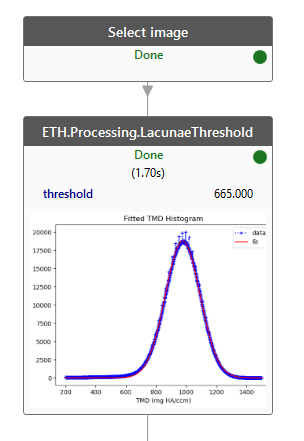
Each image will be segmented using an individual threshold value. The threshold is calculated from a histogram of the image pixel values.

A finished ETH.Processing.LacunaeThreshold job shows a plot of the histogram used to determine the threshold.
Calculating the histogram in Python takes a lot of time and memory. Switching to out-of-core image processing tools like CLIP and LUPO allows processing the 18 GB images in seconds and without requiring 18 GB RAM.
Component Labeling
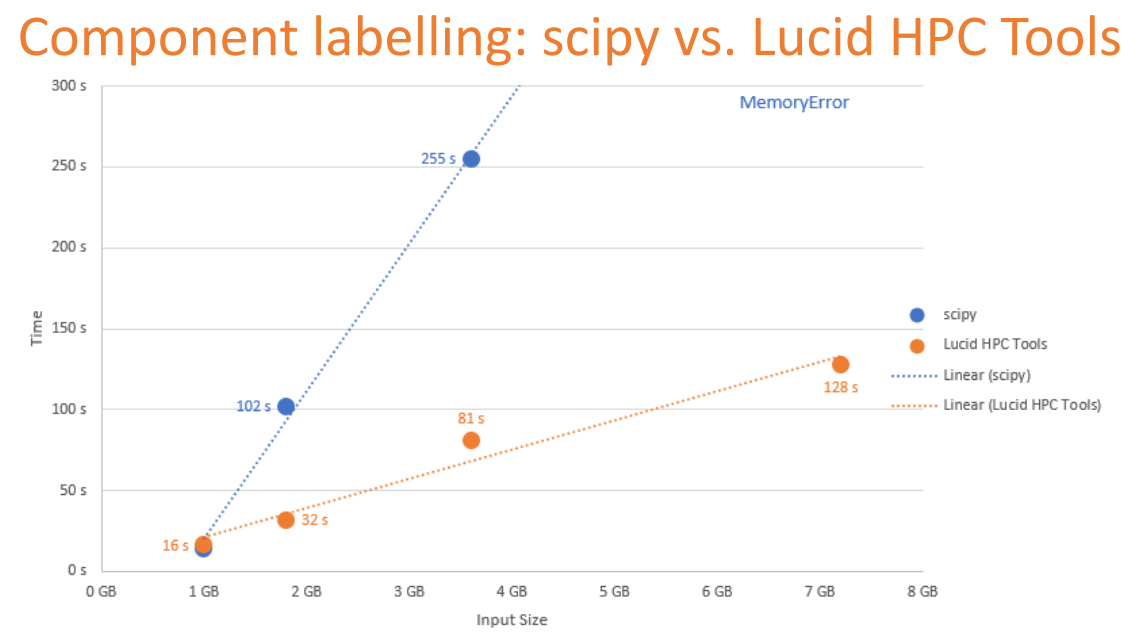
The threshold can now be used for the segmentation, and the connected components in the segments are labeled. These components can then be analysed to detect the lacunae. Each image contains on the order of ten to hundred thousand individual lacunae.
In the ETH.Processing.LacunaeDetectionAndMeasurement task type we again use out-of-core image processing tools to improve performance and reduce memory usage for these steps.

Lucid HPC Tools can process datasets larger than the available RAM, and require less time than the equivalent Python libraries.
The reduced memory requirements further permit analysis of multiple images in parallel.
This allowed us to finish the analysis for over 24 million lacunae in record time. The entire 3.5 TB dataset could be fully analysed in less than one day of computation on one worker.
Lacunar Bone Analysis
The ETH.Processing.LacunaeDetectionAndMeasurement or ETH.Processing.LacunaeMeasurement task types measure various parameters for each lacuna.
See Lacunar Bone Analysis for more details.
Visualizations and Animations
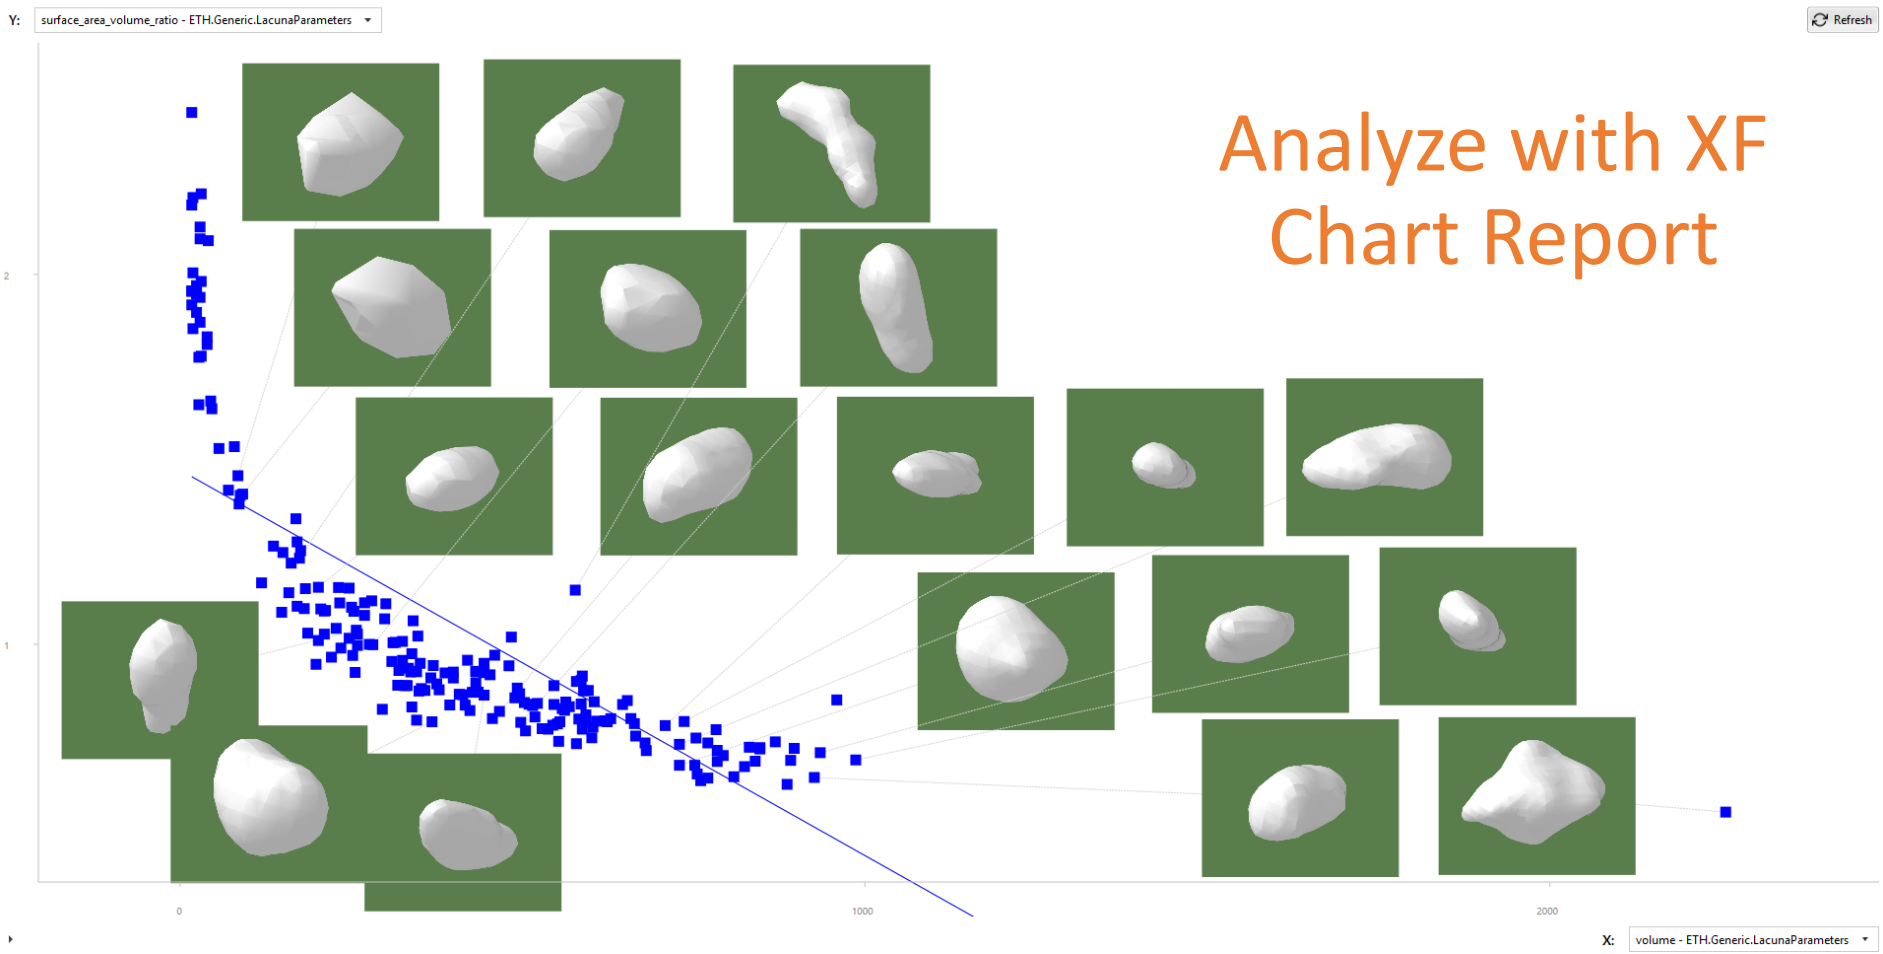
Any of the calculated lacunar parameters can be mapped onto the image and visualized in 3D. Animations were created to illustrate the distributions of these parameters in context of the original bone image.
Seee Creating videos for more details.
Spawning Runs per Lacuna
See also Spawning new runs from a task type
The ETH.Processing.LacunaeDetection task type is similar to ETH.Processing.LacunaeDetectionAndMeasurement,
but instead of performing the entire analysis
it spawns a new run for each component.
The ETH.Generic.LacunaParameters task type is automatically created in each run, to provide the required parameters.
The ETH.Processing.LacunaCrop task type can then be used to crop and analyse the VOI containing one specific lacuna.
This also enables various further possibilities, like appending task types for e.g. visualization and reporting:

XamFlow reporting tools allow creating charts, see Chart Report.
References
Osteocyte Lacunar Biomarkers in Human Rare Bone Diseases Elliott Goff Diss. ETH Zurich, 2022. https://doi.org/10.3929/ethz-b-000541902
Large-scale osteocyte lacunar morphological analysis of transiliac bone in normal and osteoporotic premenopausal women. Elliott Goff, Adi Cohen, Elizabeth Shane, Robert R. Recker, Gisela Kuhn, Ralph Müller Bone, Volume 160, 2022, 116424. https://doi.org/10.1016/j.bone.2022.116424
Large-scale quantification of human osteocyte lacunar morphological biomarkers as assessed by ultra-high-resolution desktop micro-computed tomography. Elliott Goff, Federica Buccino, Chiara Bregoli, Jonathan P. McKinley, Basil Aeppli, Robert R. Recker, Elizabeth Shane, Adi Cohen, Gisela Kuhn, Ralph Müller Bone, Volume 152, 2021, 116094. https://doi.org/10.1016/j.bone.2021.116094

